The Iowa farmland market continued to show resilience in August, holding steady overall with a few subtle adjustments compared to July. For a full look at last month’s report, see our July 2025 Farmland Market Update.
Statewide Averages
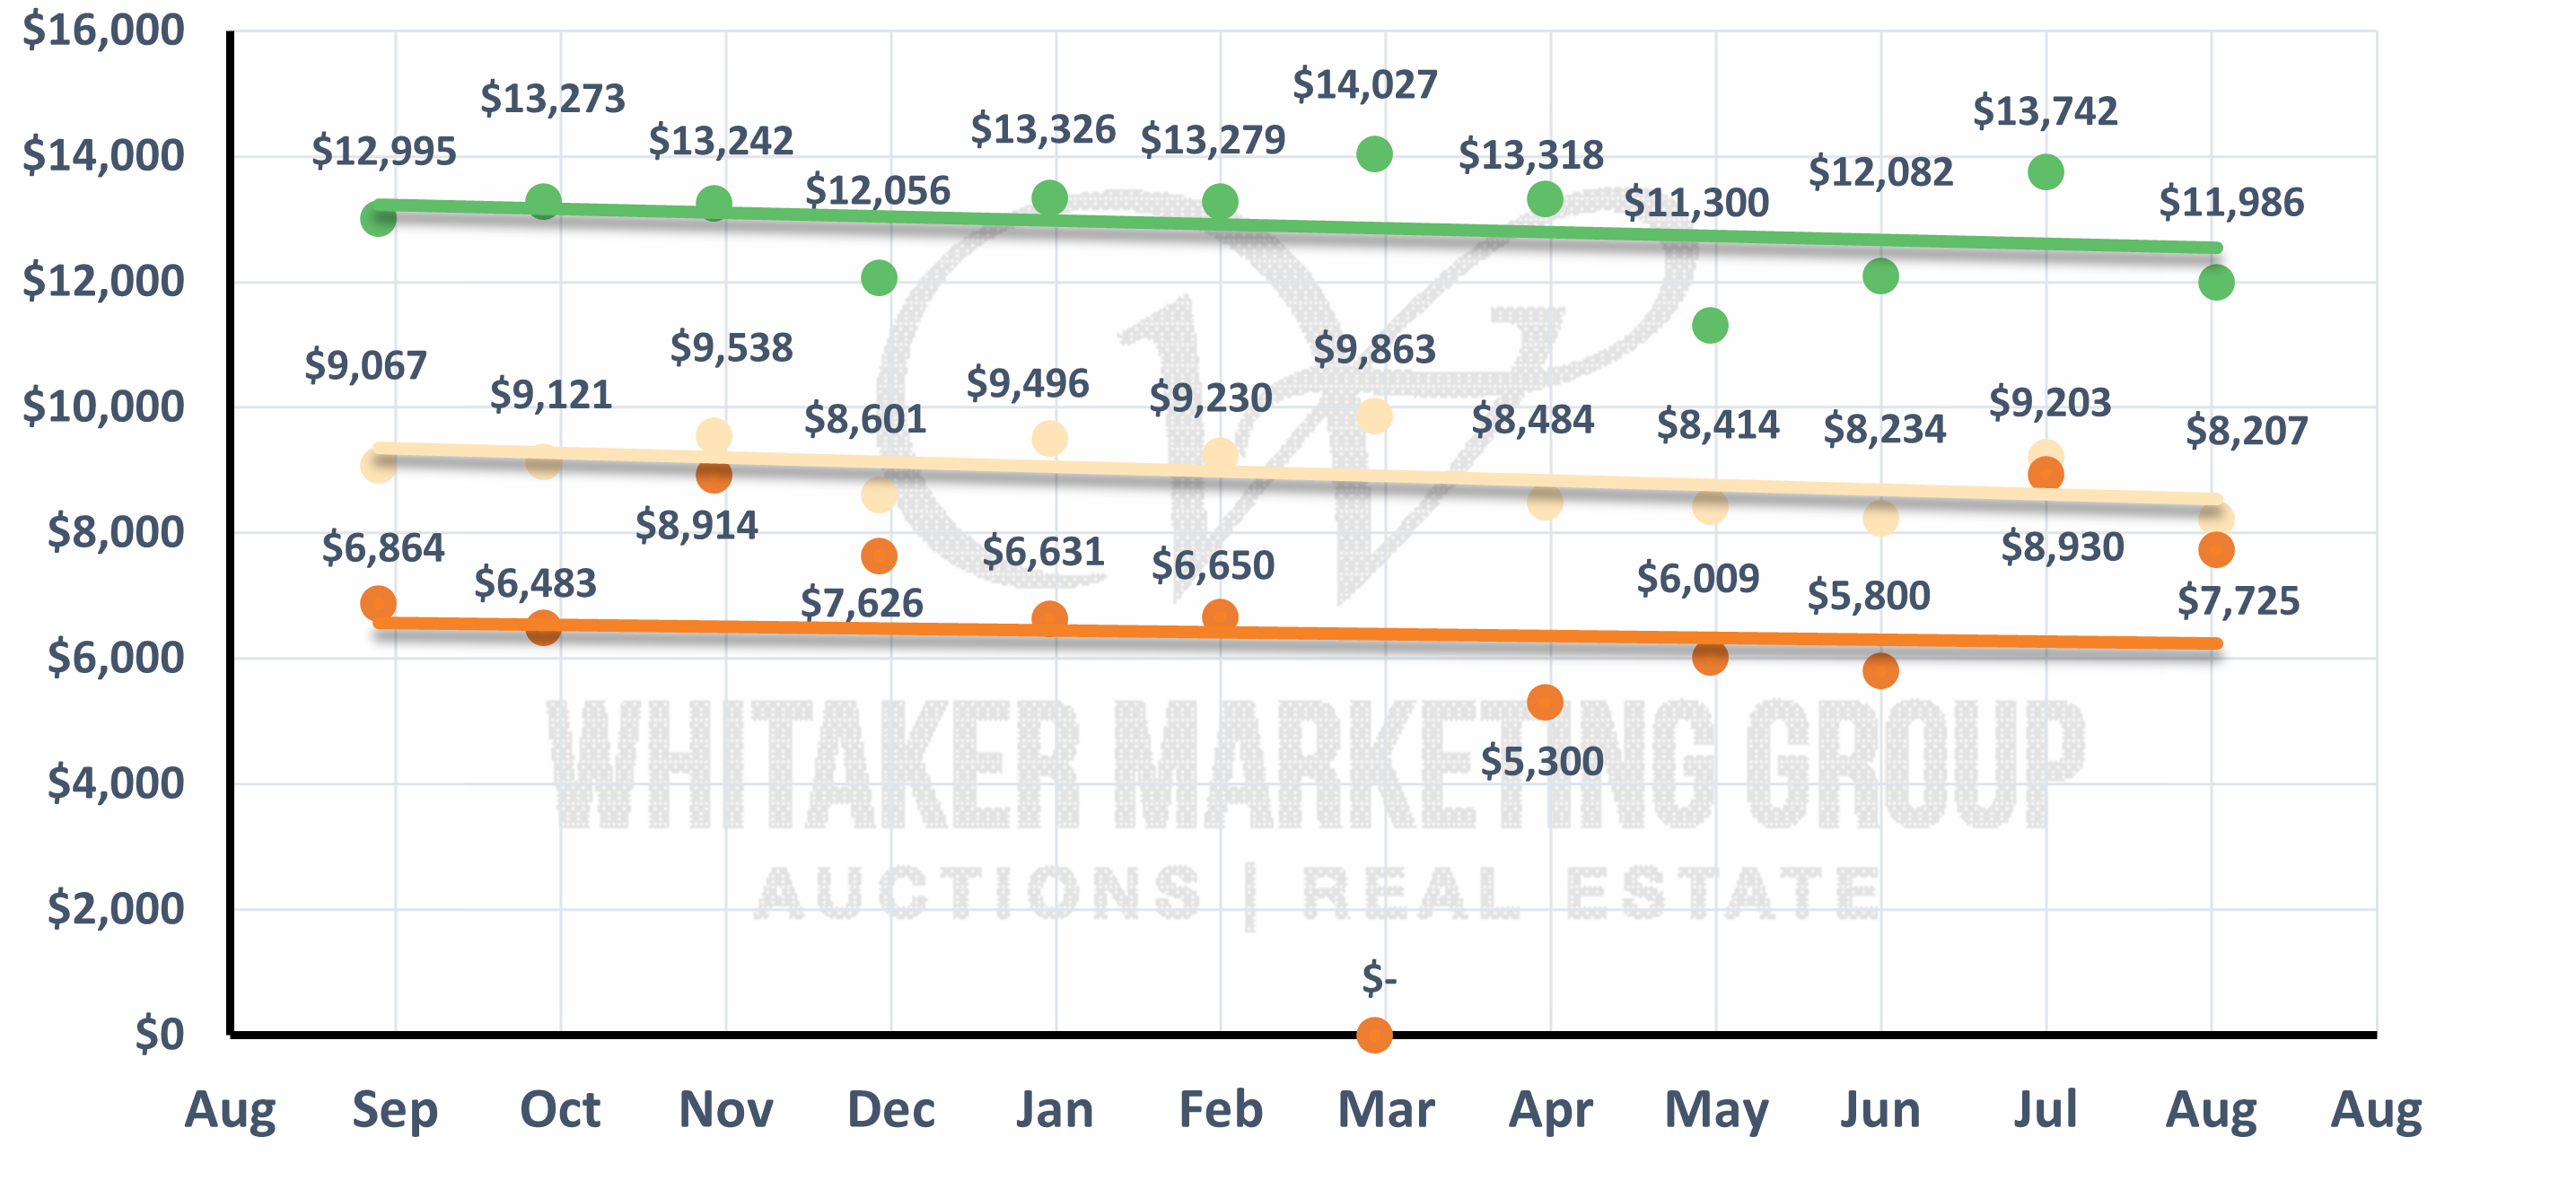
High-Quality Land: averaged $12,768/acre, up slightly from July’s $12,598.
⚖️ Medium-Quality Land: averaged $9,725/acre, a modest dip from $9,814 in July.
Low-Quality Land: averaged $7,149/acre, easing from $7,402 last month.
According to the USDA Land Values Summary, national farmland values have remained stable, and Iowa continues to track above average with high-quality land holding strong.
These shifts highlight that while the market isn’t running at the peak levels we saw in 2022–2023, strong farms continue to attract competitive bidding and demand remains reliable.
️ Regional Highlights
Northwest Iowa stood out in August with medium ground rising to $17,444/acre, up significantly from July’s $15,578.
Central Iowa held firm, with high-quality farms climbing to $13,439/acre.
South Central Iowa also strengthened, where high-quality tracts improved to $10,300/acre.
East Central and Southeast Iowa stayed steady, showing consistent buyer interest across a range of land qualities.
Auction Activity
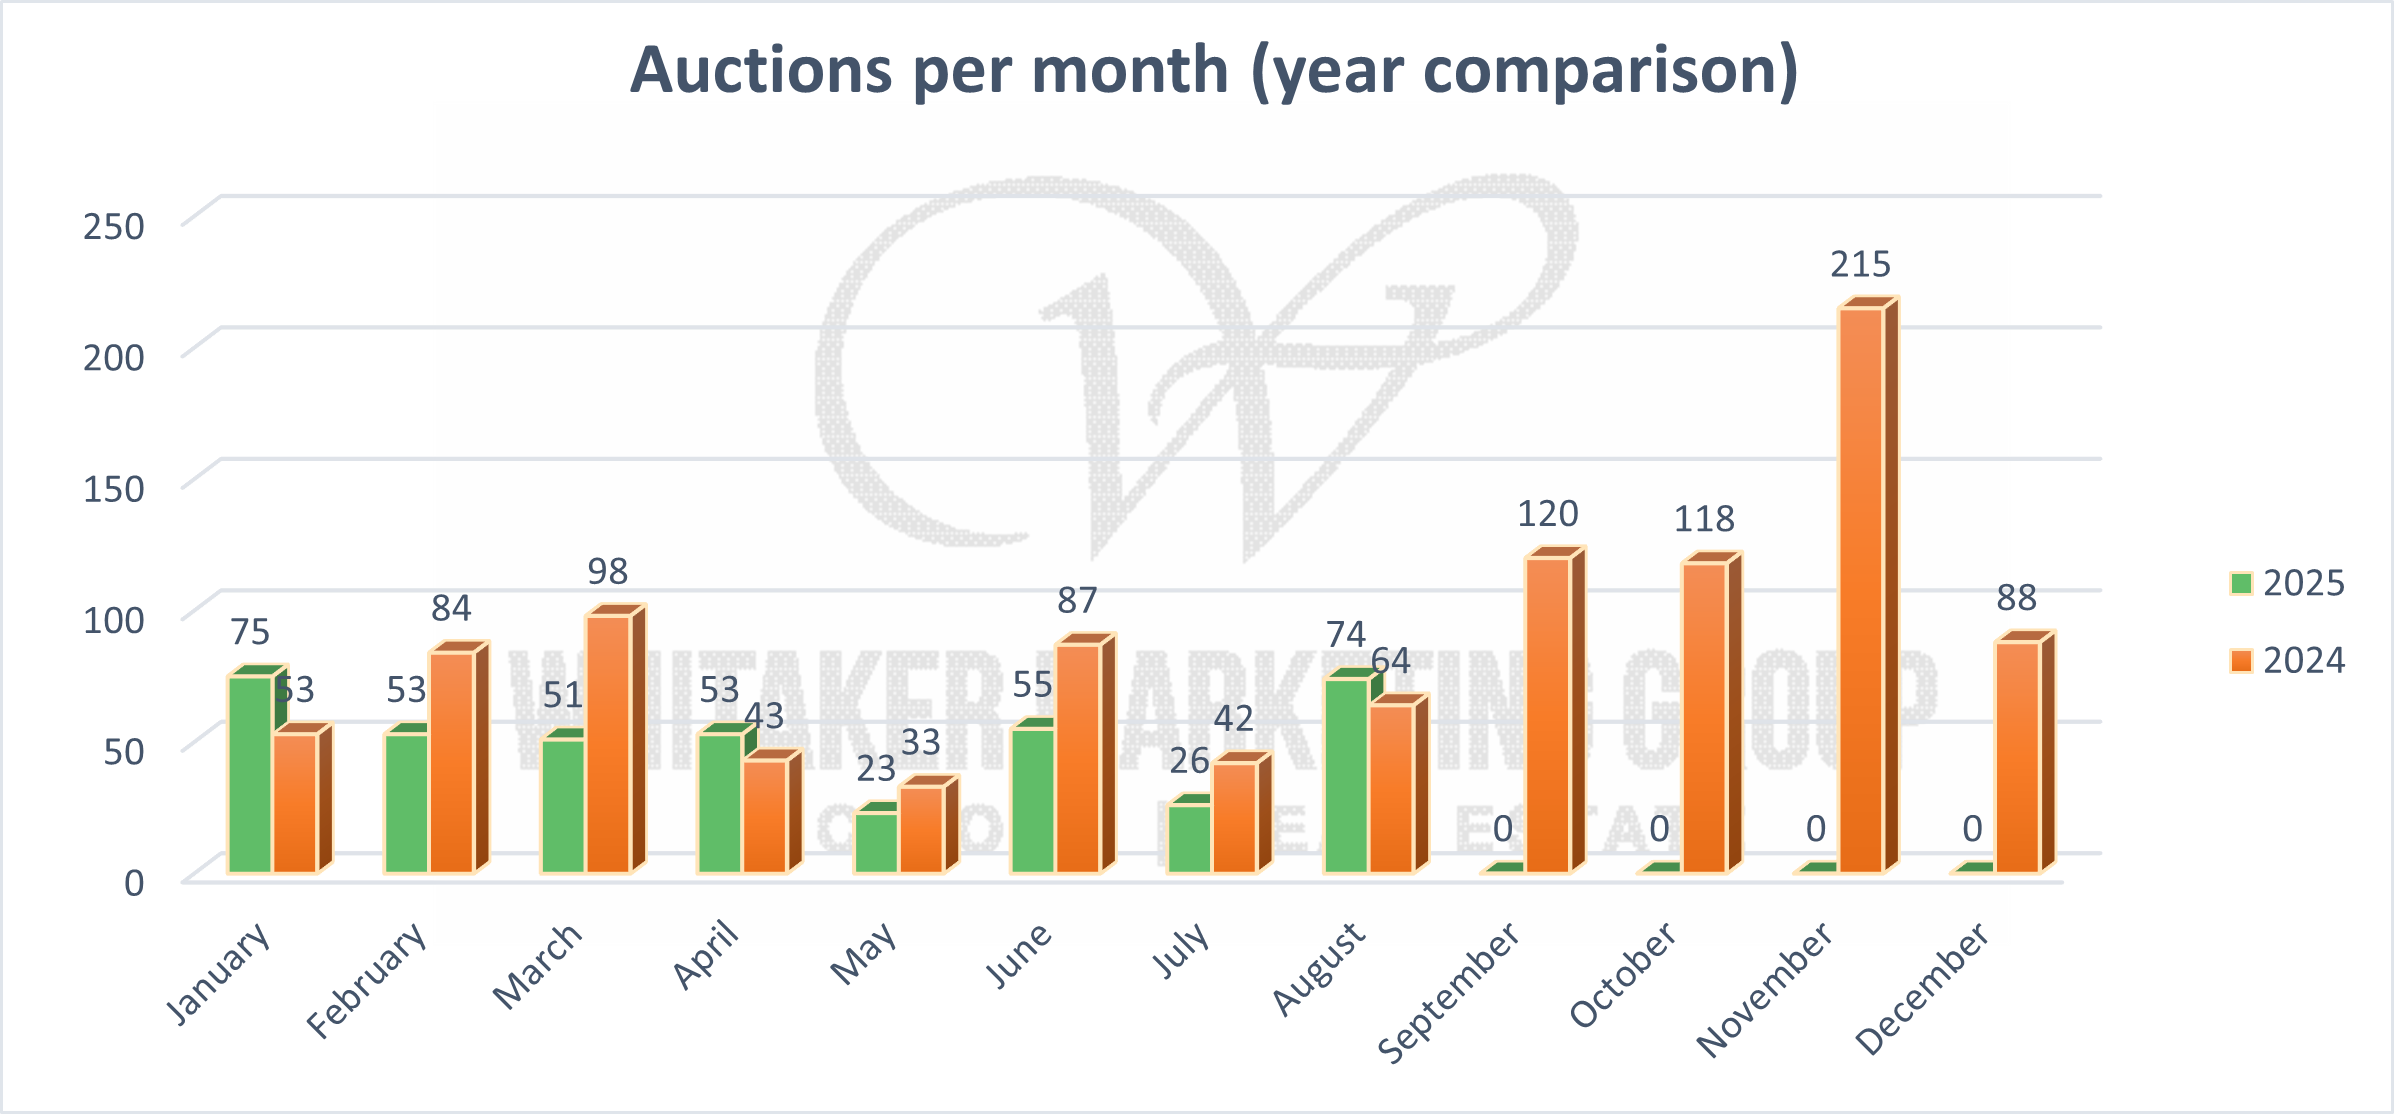
Auction activity remained relatively stable in August, with 74 farmland auctions statewide — an increase compared to 64 auctions in August 2024. While overall volume is still lighter than some prior years, the fall season historically brings a surge in sales, and we anticipate September through December to set the tone for year-end values.
Outlook
The Iowa farmland market continues to show remarkable resilience despite broader economic headwinds. High-quality tracts are still commanding premium prices, and medium-quality farms remain well-supported. As we head into harvest and the busy fall auction season, sellers of well-positioned land are in a strong position to achieve solid results.
Thinking about selling? Call us today at 515-996-5263 to discuss your options!
Explore more insight in our Farmland Market Blogs
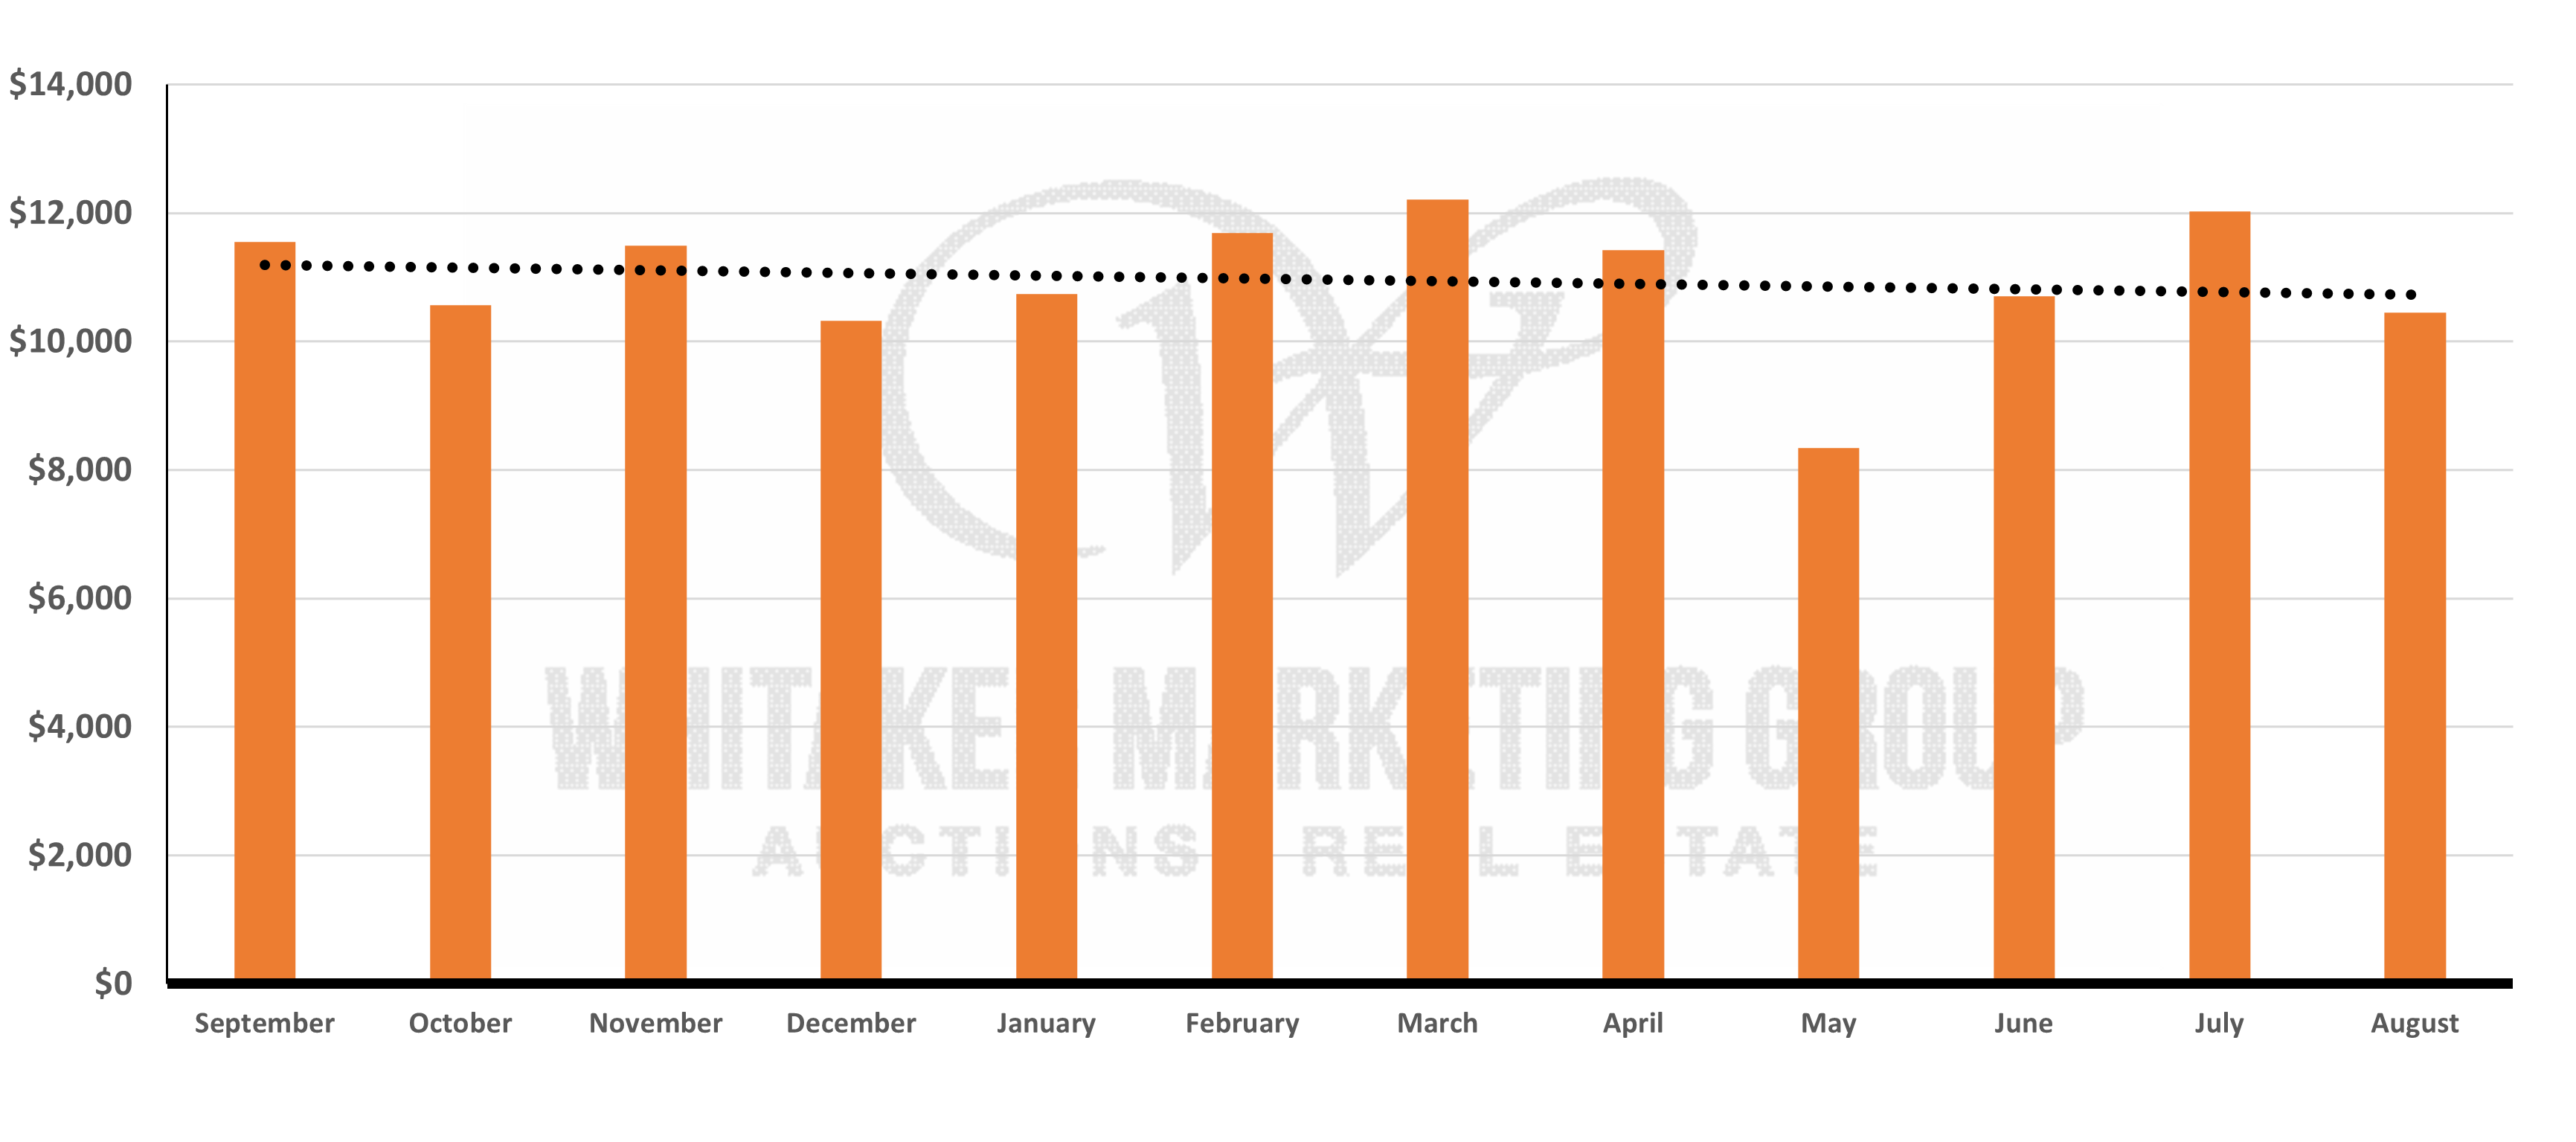
For a detailed breakdown of regional pricing and auction activity, check out the graphs below.
David & Ann Whitaker | Iowa Land Guy
When you think of Farmland Think of US!


